The 100-Year Flood Is Not What You Think
Why the 100-year flood can happen more than once in a century
The “100-year flood”
People hear the phrase and assume rarity.
Once in a lifetime. Maybe once in a century.
Something you can shrug off ~ if you plan to sell before retirement.
But that’s not how the math works at all.
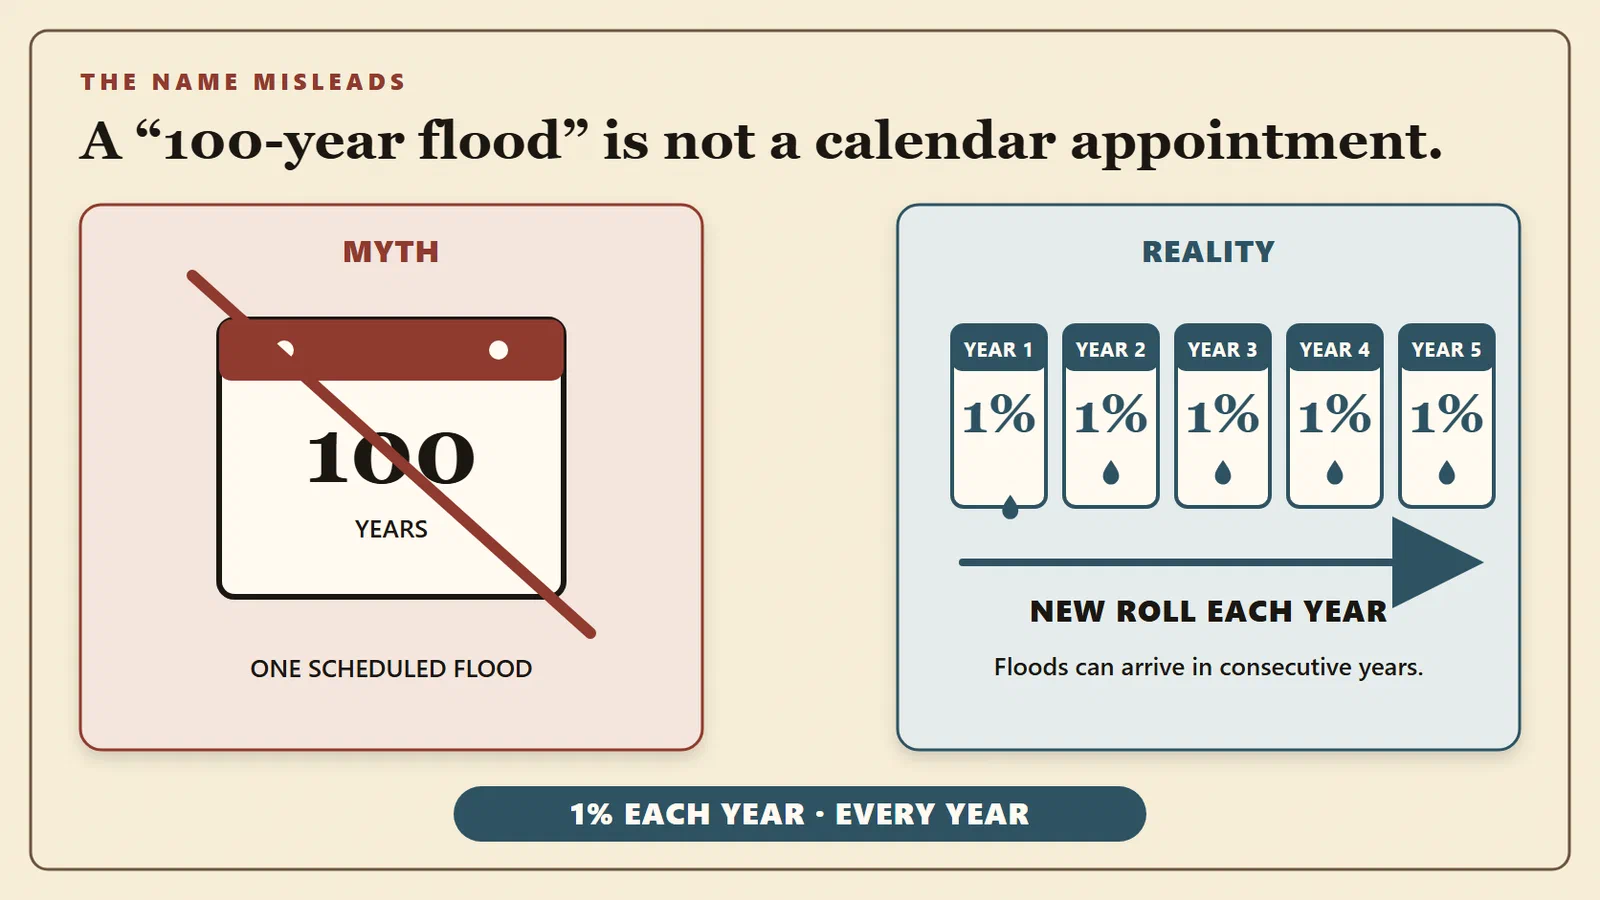
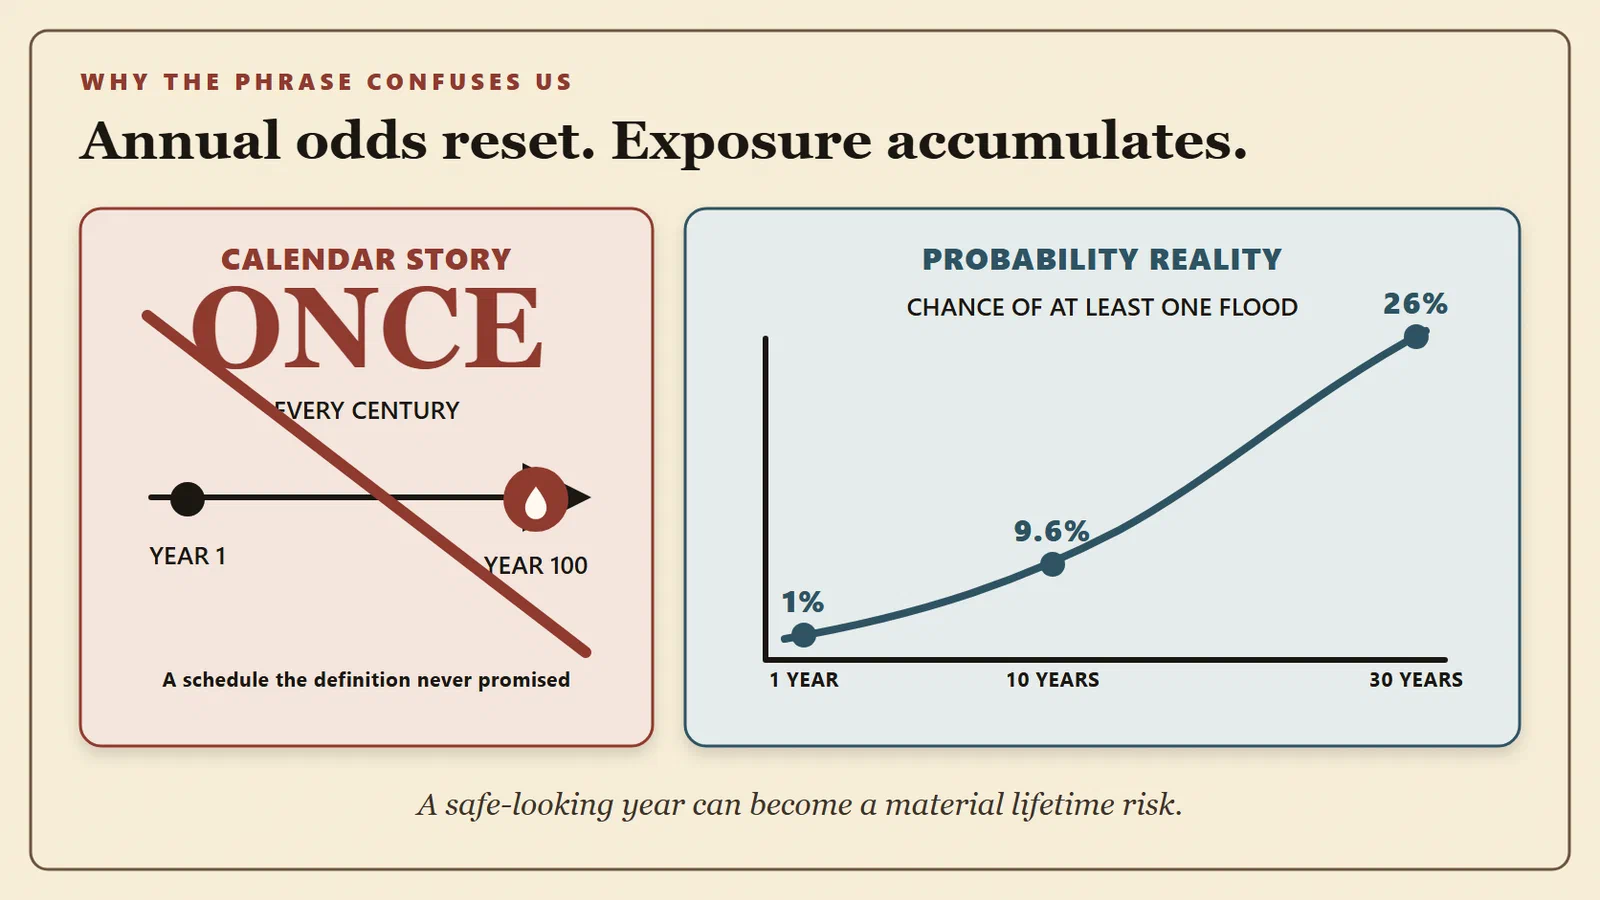
A “100-year flood” does not mean one flood every hundred years. It means something far more mundane and far more dangerous: a 1% chance every year, repeated over and over again.
Same risk. New roll of the dice. Every year.
Only one of those dice rolls needs to come up “flood” to make your flood insurance worth its premium.
So, how likely is your house to flood if you live in the 100-year floodplain?
One Year, One Chance, Raised to the Power of Time
The Technical Setup
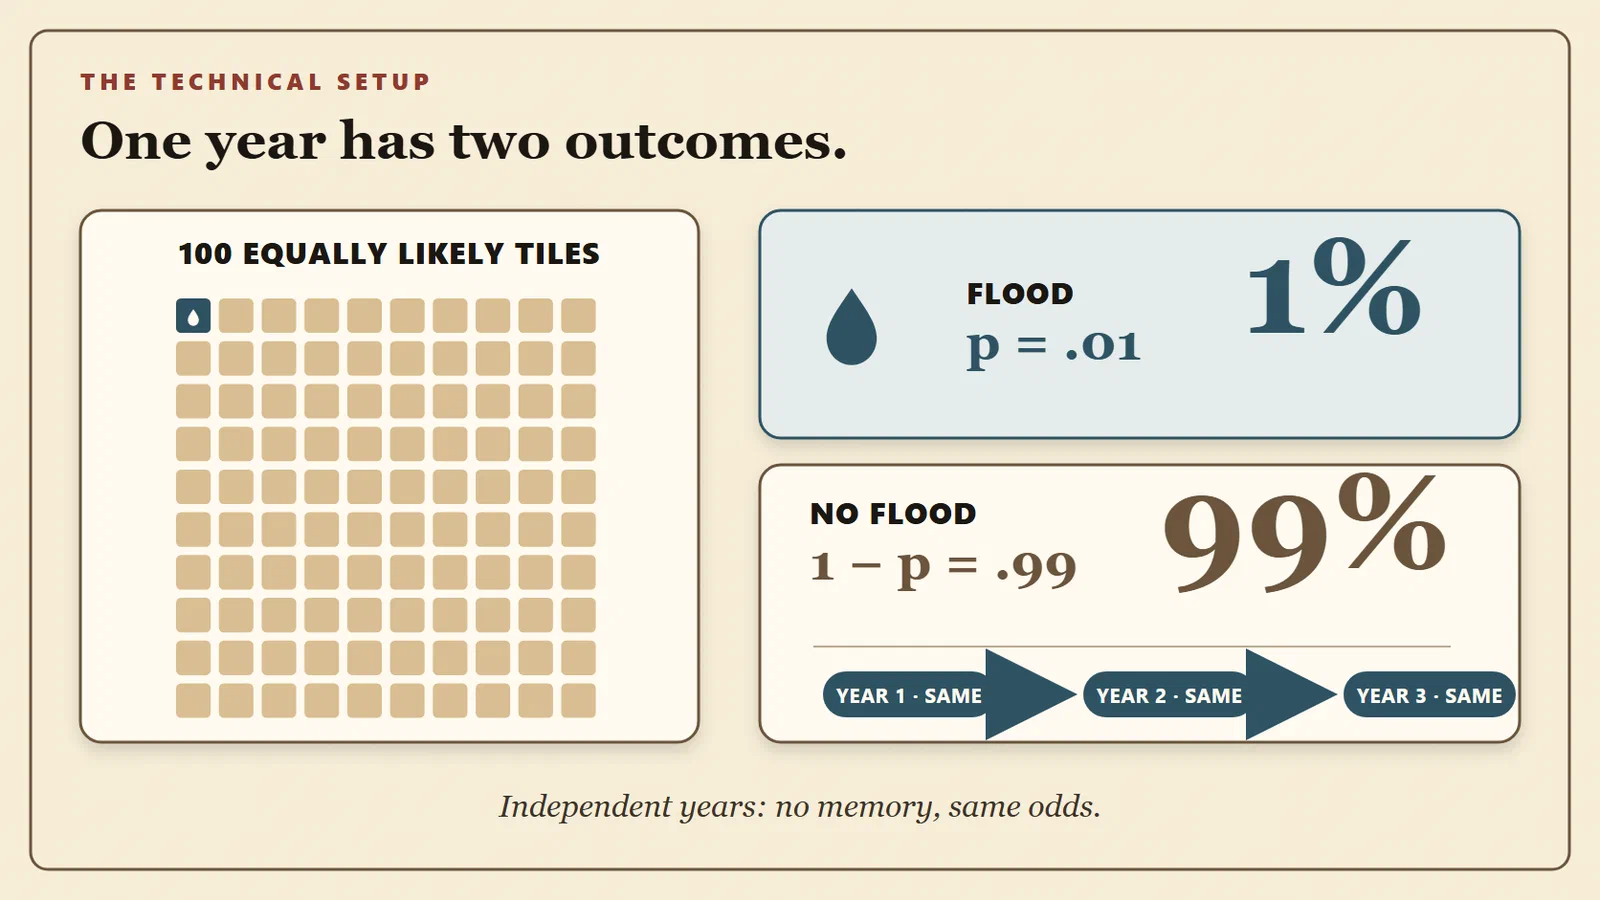
A 100-year flood has a 1% annual probability. In shorthand, p = 0.01 is the chance of a flood in a given year, and 1 - p = 0.99 is the chance of no flood in that year.
Now assume what all of the flood maps quietly assume ~ that each year is independent and the probability stays constant every time.
No memory.
No mercy.
Just repetition.
Where Time Does the Damage
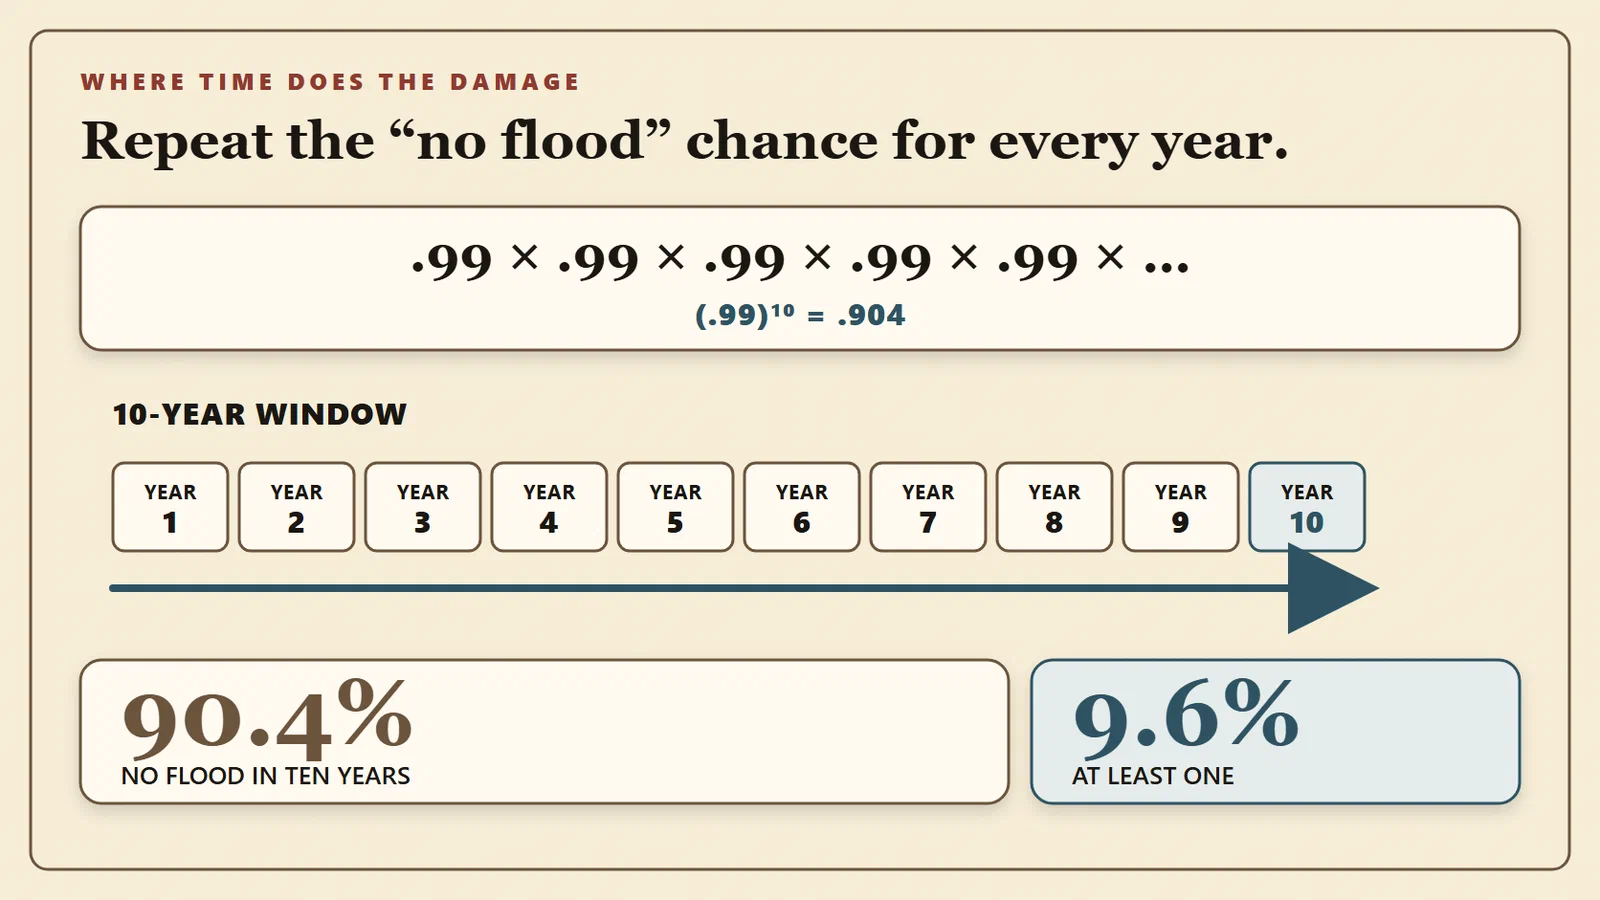
If you want to know the chance of no floods over a number of years, you multiply that 0.99 over and over again. Its exponential!
After some number (n) years: P(no flood in n years) = (0.99)^n
If you look over a decade, you get: P = (0.99)^10 = about 90% So, over any decade you have something like a 90% chance of NOT experiencing a flood.
But people don’t care about no floods.
They care about whether at least one flood shows up and wrecks their
day.
The True Risk in the 100-Year Floodplain
“At least one flood” is simply the opposite of “no floods.”
The probability we care about is: P(at least 1 flood in n years) = 1 - (0.99)^n
That’s it. That’s the whole trick.
Makes sense right?
A 30-Year Mortgage Example
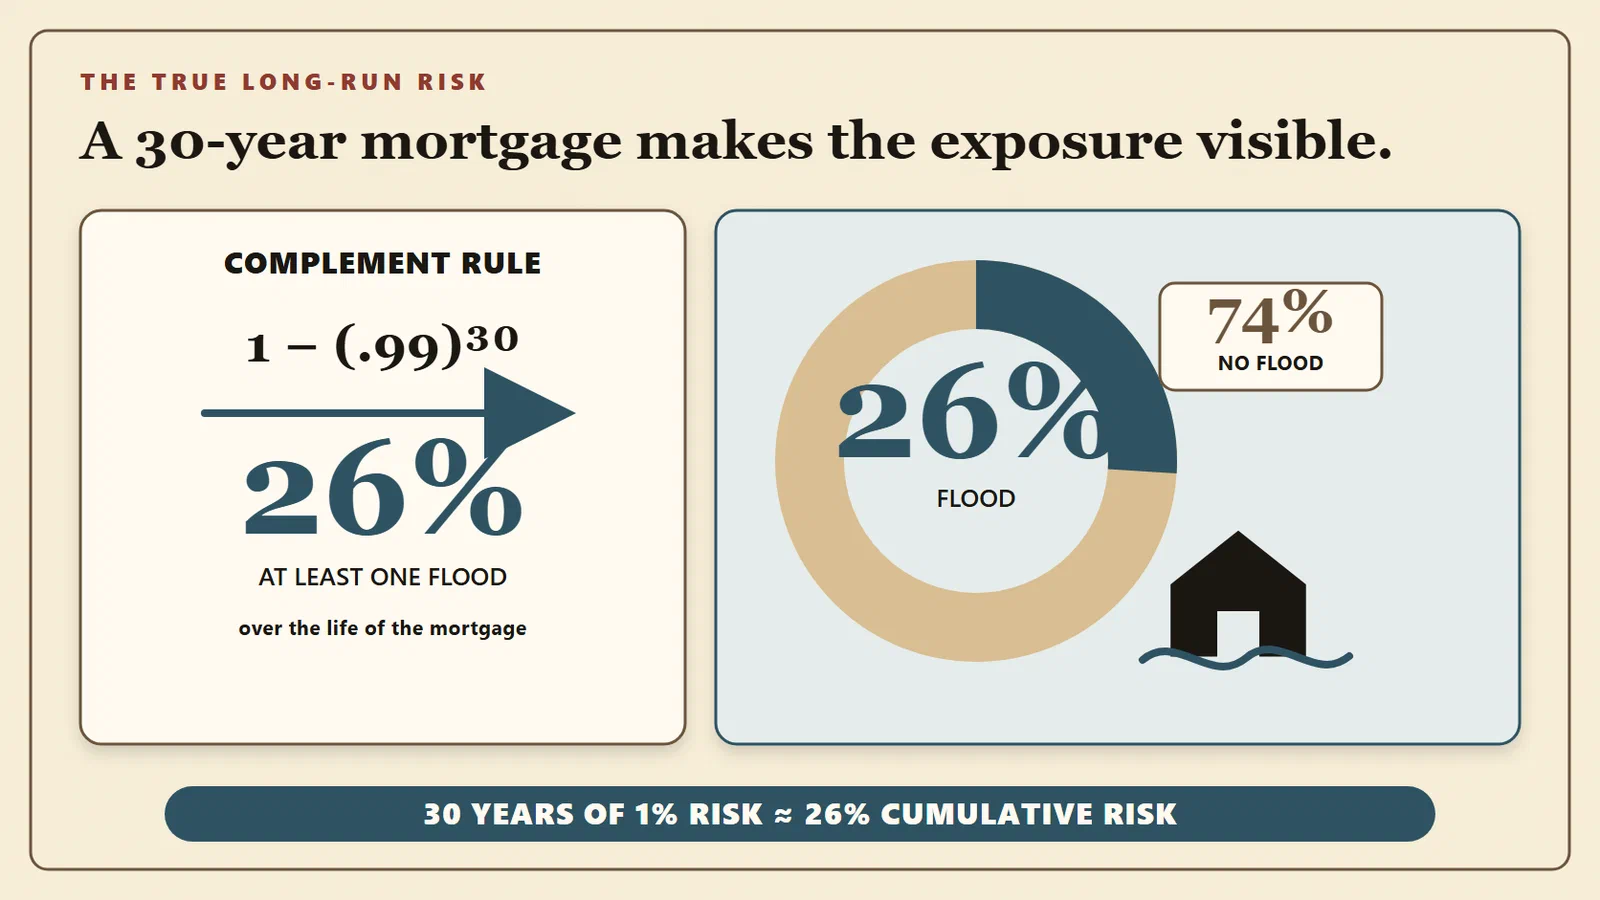
Replace n with 30: 1 - (0.99)^30
Crunch the number: (0.99)^30 = about 0.7397
So the probability of at least one 100-year flood over the life of
the mortgage is: 1 - 0.7397 = 0.26031
About 26%.
Twenty-six percent!
That’s somewhere between a coin flip and a roll of the dice. And you’d better hope you don’t come up with snake eyes!
Why This Confuses So Many People
The phrase “100-year flood” sounds like a calendar event.
It feels distant.
Abstract.
Somebody else’s problem.
In reality, it’s a repeated gamble with modest odds that quietly stack up over time. The risk doesn’t announce itself loudly ~
It accumulates as your exposure extends across time.
Any one year feels quite safe, and it probably should. The mistake many people make is thinking that a 100-year flood is completely irrelevant. Over the long haul, even something as rare as a 1% annual chance will compound.
Eventually, the flood waters will rise, and if you live in the floodplain, then understanding the risk isn’t optional ~
It’s your responsibility.
The Insurance Decision, In Plain English
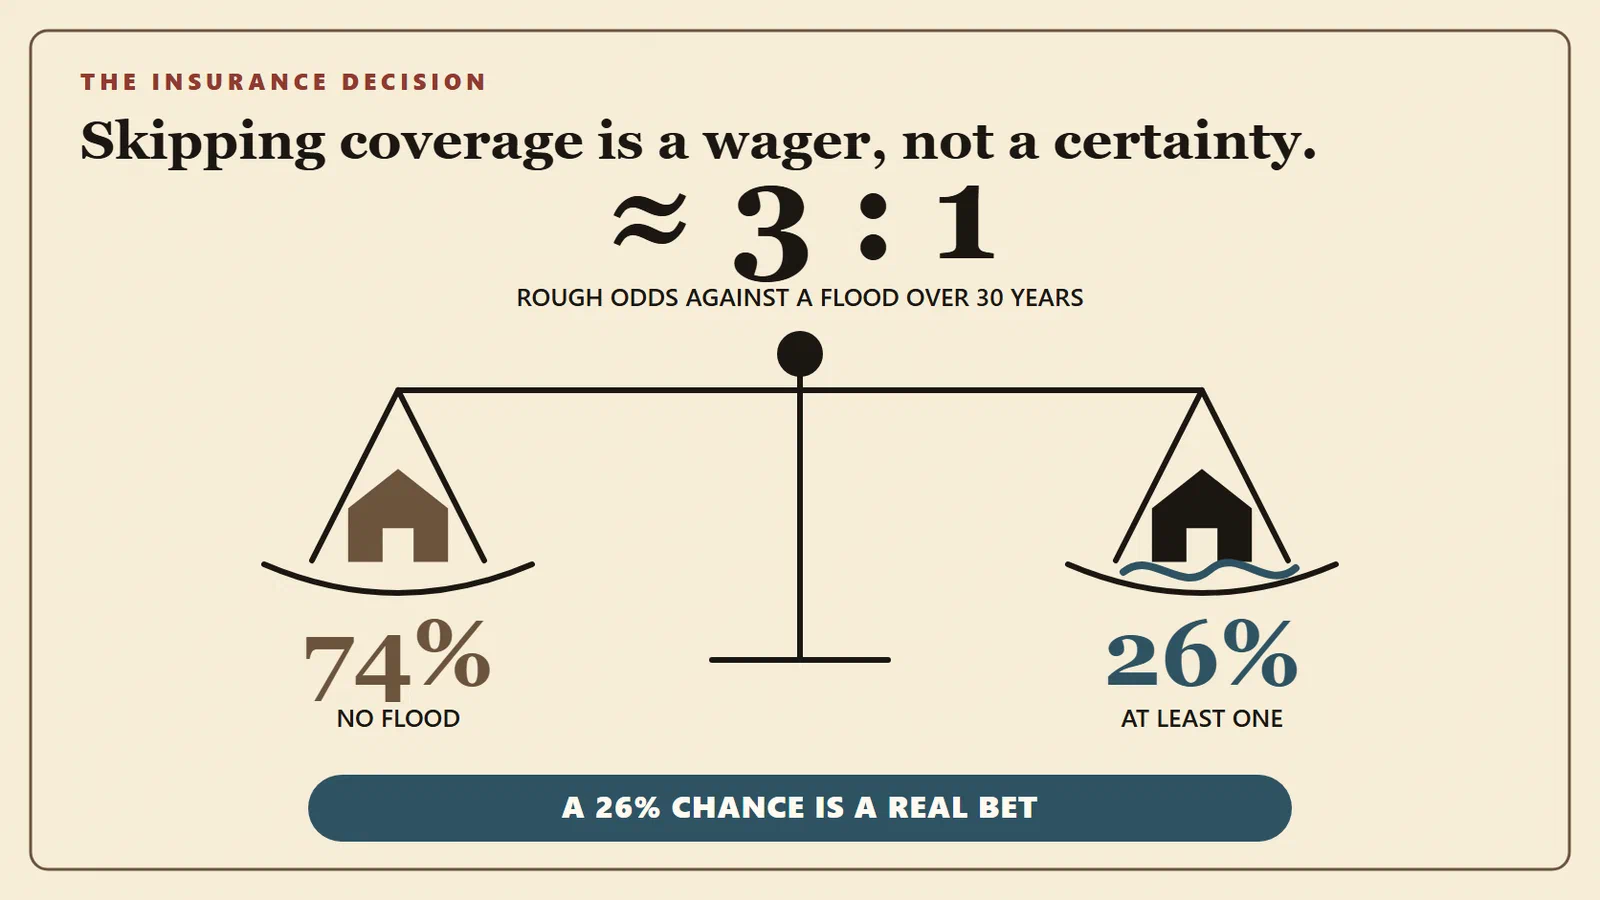
Choosing not to buy flood insurance in the 100-year floodplain isn’t a principled stand against bad science. It’s a bet.
Vegas would give you roughly 3 to 1 odds.
Not quite a coin flip.
Not quite snake eyes.
Somewhere in between.
But in this case, the house does not always win.
Source and Risk Note
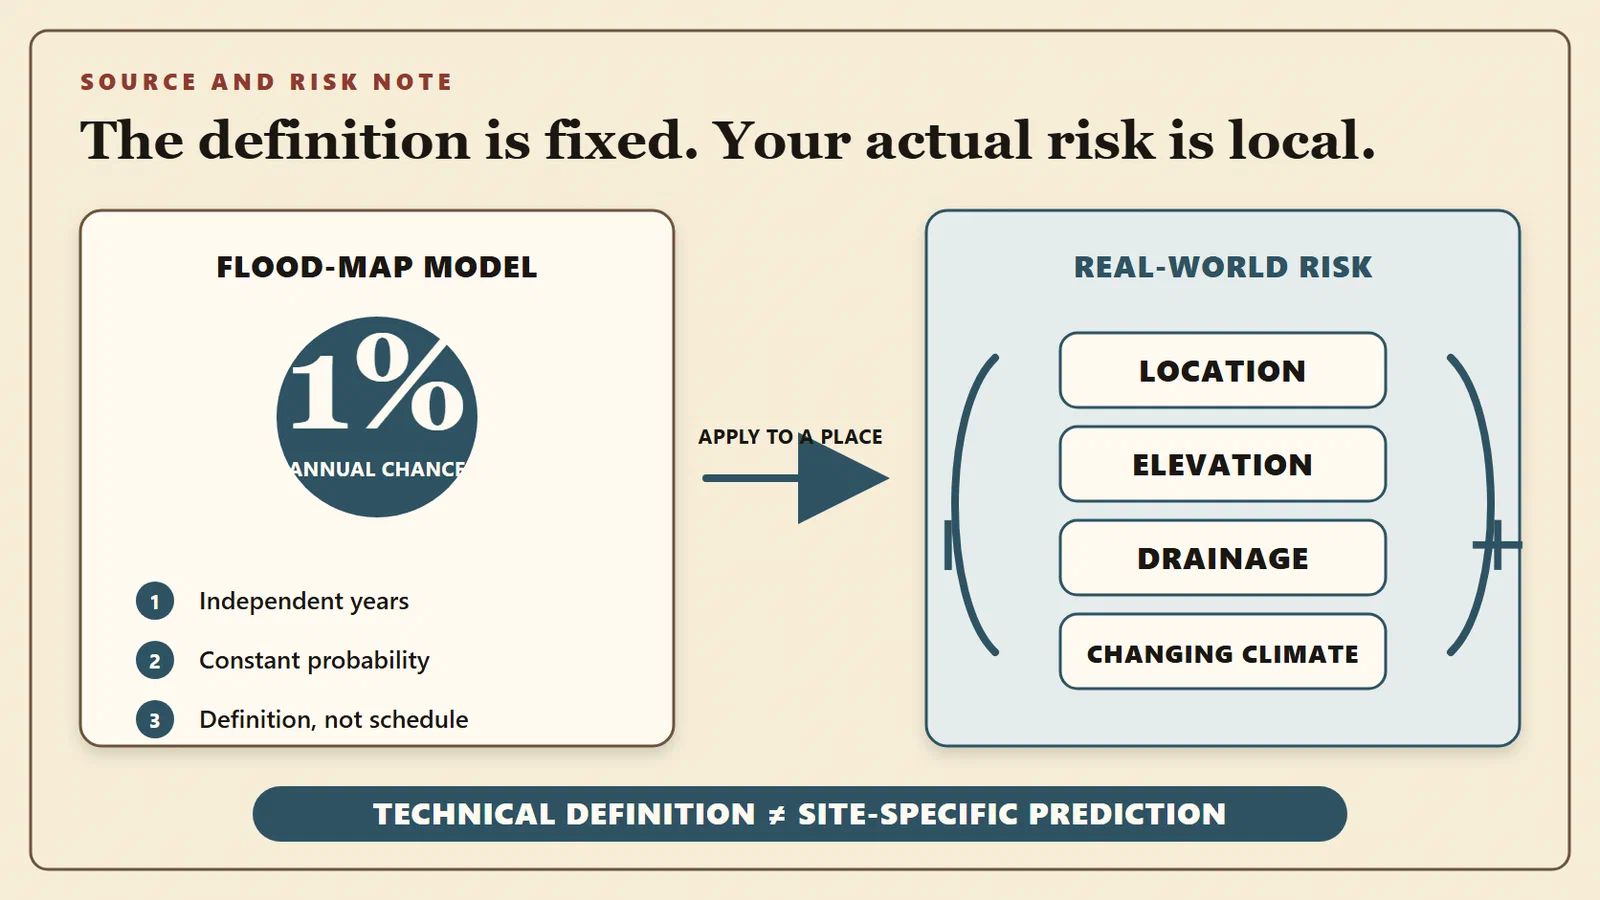
The term “100-year flood” is a technical definition, not a prediction. FEMA describes the 100-year flood as the 1% annual chance flood and uses the same 26% figure for a 30-year mortgage in high-risk flood zones. The math here assumes independence and constant risk, which is how floodplain maps are formally constructed.
Real-world flood risk can be higher or lower depending on location, elevation, drainage, and changing climate conditions.