The Map That Priced the Fire
A fire-insurance map made Jacksonville legible after catastrophe, then carried the same narrow discipline into archives, brownfield files, and the civic habit of reading risk before memory hardens.
The Sheet On The Table
Open the 1903 Sanborn atlas for Jacksonville and the city looks less like a place than a set of decisions awaiting a price. The Library of Congress item page describes the edition plainly: Sanborn Map Company, 1903, 78 sheets, six skeleton maps, bound. The scale and binding are quiet facts. The drawing is less quiet. The blocks carry color. Streets set the frame. Buildings have footprints, stories, uses, roof marks, wall marks, and labels. The city becomes a surface that can be read by someone who has never walked into the heat of Bay Street, never handled moss in a warehouse, never smelled charred pine.
That plain office use gives the sheet its lasting force. The 1903 Jacksonville map came from office work, outside the genre of public memorial or civic self-portrait. It was a working insurance document, made for people who needed to price exposure with enough consistency to keep capital alive after fire. Yet the discipline that served that private purpose gave later readers a sharper record than many more sentimental accounts. Walls, roofs, water lines, building uses, elevators, sheds, ovens, stables, mills, warehouses, and empty lots all pressed themselves into the same system of signs.
The map asks a hard question before it answers any nostalgic one: what has to become visible before a city can be insured, taxed, rebuilt, preserved, blamed, or cleaned up? A city tells stories about founders, fires, booms, and recoveries. The Sanborn sheet tells a colder story. It says where the combustible surfaces stood. It says where water could reach. It says which blocks carried dense commercial load, which lots held industrial uses, which structures shared walls, which streets gave a fire crew a chance, and which places were worth measuring because risk had already learned to see them.
That is the civic power of the object. It began as a private instrument for pricing the combustible city. Its attention to walls, roofs, streets, water, uses, and hazards later made it one of the strongest public records for reading urban change, hidden property risk, and the limits of memory. The map does not remember as a resident remembers. It remembers as a system remembers: by category, by omission, by repeated inspection, by correction, by the steady conversion of messy human settlement into a file that can travel.
Jacksonville gives the sheet a dramatic setting, but drama can mislead. The 1903 map is not valuable because it sits near a famous fire. It is valuable because it shows the city after fire had already become an accounting problem, an engineering problem, a land-use problem, and a public-memory problem. It catches rebuilding in a language made for underwriters. That makes it a civic document by accident and a risk document by design.
Fire, Moss, Wind
Florida Memory, the public history site of the State Library and Archives of Florida, gives the beginning with painful economy. On May 3, 1901, a spark from a kitchen fire ignited drying Spanish moss at a mattress factory near Davis and Beaver streets. The fire spread through Jacksonville’s downtown. By 8:30 that night, according to Florida Memory, 2,368 buildings were destroyed, 10,000 people were homeless, seven residents were dead, and 146 blocks had burned. Governor William Jennings declared martial law. Municipal authority resumed on May 17. The city spent the next decade rebuilding its downtown.
Those facts sit like weights. They also show why the map cannot be treated as a substitute for the disaster. Seven dead residents disappear if the reader lets the map do all the work. People who lost houses, jobs, account books, heirlooms, churches, clubs, and kin networks disappear too. The sheet records structures and risk. It does not carry grief. That limit deserves attention because the map is beautiful in a way that can tempt a reader toward aesthetic comfort. The colors calm the damage. The ruled lines clean the mess. The neatness makes the loss look manageable.
The Jacksonville sequence at the Library of Congress helps restore time to the page. The 1897 edition has 47 sheets. The 1903 edition has 78 sheets and six skeleton maps. A 1913 volume has 128 sheets, a map of the congested district, and eight skeleton maps. That growth in sheets does not tell a full history by itself. It does show that the mapped city changed in coverage, density, and administrative demand. A fire insurance atlas expanded as the city demanded fresh description. Each edition made a new claim about what had become worth measuring.
The best companion source for that sequence is the 1904 Polk’s Jacksonville City Directory
, digitized by the Jacksonville Public Library Florida Collection. Its item record carries a No copyright - United States rights statement and describes a 684-page directory. Its preface counts 17,784 names. Its city pages list the fire department, five stations, and fire alarm boxes; its commercial entries put banks around Bay and Main, Bay and Laura, and Laura and Forsyth; its classified section lists H. J. Klutho among architects at 108 W. Forsyth. The directory supplies an address-and-actor layer beside the map’s risk layer. One record shows walls, roofs, and exposures. The other shows names, offices, trades, and civic apparatus returning to the same streets.
The 1897 atlas belongs to the city before the great fire. The 1903 atlas belongs to the city after the disaster had been folded into reconstruction. The 1913 atlas belongs to a city that had spent a decade turning ruin into a new downtown. Read in sequence, the maps make one of urban history’s central facts visible: recovery unfolds through approvals, loans, materials, designs, inspections, street work, water access, labor, and public confidence. A fire ends in hours. The record of replacement arrives in editions.
The old moss at Davis and Beaver gives the story a tactile origin. Spanish moss dried for mattresses sounds almost domestic, even soft. A Sanborn sheet translates that world into hazard language. It cares less about softness than proximity, ignition, roof material, wall behavior, and the chance that one burning building will teach its neighbors to burn. In that sense, the map is a moral shock because it refuses romance. It does not say that Jacksonville rose heroically after disaster. It shows that the rebuilt city had to become legible to people who asked how the next fire would move.

Image 1: the surveyor’s discipline, rendered as civic paperwork.
Why The Insurer Needed A Map
The Library of Congress introduction to the Sanborn collection starts with the collection’s scale. Sanborn maps form a uniform large-scale series covering commercial, industrial, and residential sections of about 12,000 cities and towns in the United States, Canada, and Mexico, with maps beginning in 1867. The Library describes about 50,000 editions and an estimated 700,000 sheets, the largest extant collection of maps produced by the Sanborn Map Company. That scale is the result of an ordinary commercial pressure: insurers needed current, detailed building information across cities too large for memory.
That pressure had a geography. The fire map was most useful where a single building could no longer be judged alone. The value of the record lay in relation: a bakery beside frame dwellings, a warehouse near a narrow alley, a foundry behind shops, a hotel with exposure on several sides, a block whose water access looked better on a civic boast than on a measured sheet. The map made adjacency visible. It forced property to admit that its risk lived partly next door.
Before systematic fire insurance mapping, an insurer could depend more heavily on local inspection, reputation, and rough knowledge. That approach broke under urban growth. Dense blocks carried shared exposure. A brick wall, a party wall, a wood cornice, a shingle roof, a narrow alley, a poorly placed hydrant, a varnish shop, a bakery oven, or a livery stable could alter the risk for an entire block. The building next door mattered. The water main two streets away mattered. A property could be priced badly because a clerk lacked one detail about a wall he had never seen.
The Library of Congress account reaches back to the 1835 New York fire, which caused more than $20 million in losses and wiped out many smaller insurers. One fire did not create the Sanborn system by itself. Nineteenth-century American cities had already made private risk social. One owner could insure one building, yet fire could travel across property lines faster than paperwork. The insurer needed a record that made the block visible as a linked hazard. The city had become too dense for isolated judgment.
Daniel Alfred Sanborn entered that world as a civil engineer and surveyor. The Library of Congress history places his early work in Boston in the 1860s and follows the company into a national mapping business. Sanborn’s maps were specialized products prepared for the exclusive use of fire insurance companies and underwriters. That exclusivity changes the reading. The sheets were not drawn for city beautiful campaigns, tourist bureaus, or family albums. They answered a business question: how much fire exposure sits here, and what physical facts should set the rate?
The answer required a new kind of city sight. A Sanborn map compresses field observation, clerical habit, measurement, and classification into a sheet that lets distant readers compare blocks. It gives the underwriter a portable city. That portability had consequences. Once a building became a colored footprint with coded walls and uses, it entered a system that could be updated, filed, copied, and reused. The record made risk mobile. A block in Jacksonville, Coney Island, Santa Fe, or Minneapolis could be handled through common graphic rules.
The private map therefore stands near the birth of many public habits. Modern preservation offices, local historians, environmental professionals, genealogists, planners, and residents now ask questions that Sanborn’s business never set out to answer. They use the sheets to locate vanished shops, old tanks, theaters, laundries, garages, schools, tenements, rail spurs, churches, and house numbers. That later use does not erase the original purpose. It depends on it. The map is powerful because a narrow purpose forced unusual care.
The Surveyor’s Eye
The surveyor’s eye is the essay’s real subject. The person who gathered data for a Sanborn atlas had to treat a city as a set of visible, classifiable, repeatable facts. The Library of Congress notes that Sanborn published a 1905 Surveyors’ Manual for the exclusive use and guidance of employees, followed by later editions, to keep mapping standards uniform. Institutional guides to Sanborn use describe the basic working method in similar terms: surveyors leaned on available records where useful, then checked built-up areas through field observation when records were incomplete.
That practice produced a strange kind of intimacy. The surveyor did not need to know who quarreled in a boarding house, who played cards in a back room, who worshiped upstairs, or who repaired shoes beside a stove. He needed to know the number of stories, the material of the wall, the roof, the use, the presence of an elevator, the route of a stair, the position of a boiler, the relation of one building to the next, and the fire protection available nearby. He saw through the emotional city toward the combustible one.
This could make the map feel inhuman. It also explains the density of the evidence. A sentimental city record often saves the exceptional: mayoral speeches, parade photos, grand buildings, disaster ruins, famous residents. A Sanborn sheet saves ordinary arrangements because ordinary arrangements changed premiums. A shed behind a shop mattered. A small laundry mattered. A paint room mattered. A warehouse opening onto an alley mattered. The value of the source comes from the smallness of its attention.
The Sanborn sheet also shows how knowledge gets disciplined. A surveyor cannot invent a private symbol for every observation and expect the office to understand it. A company cannot sell maps nationally if each city speaks a different graphic dialect. The key, abbreviation, color, and sheet index create a common language. The map becomes more than drawing. It becomes a controlled vocabulary for risk.
That controlled vocabulary never escapes judgment. A surveyor decides what falls inside the mapped area. The company decides which districts merit coverage. A symbol compresses reality. A use label can flatten a complicated business. A vacant lot may hide a history that the fire map has no reason to hold. Yet the discipline does something rare. It creates a record that later readers can test across editions. If a brick warehouse replaces a wood shop, the change can appear. If a residential block gains garages, the change can appear. If an industrial use fades and a public park arrives, the change can appear.
Jacksonville’s 1903 atlas, in that sense, is a surveyor’s answer to catastrophe. It does not stage a civic comeback. It updates the risk grammar. The rebuilt city becomes legible through the same categories that made the older city insurable. That continuity is unsettling. Disaster can feel like a break in time. The map treats it as an urgent revision.
Color As Code
Sanborn color is one reason these maps keep attracting viewers who have no connection to insurance history. A block of yellow, pink, blue, gray, or brown on cream paper can look almost decorative. The Library of Congress warns against that easy reading in its guide to keys, legends, and symbol sheets. Fire insurance maps used a sophisticated symbol system, and their interpretation depends on the keys and manuals that governed color, abbreviations, construction marks, and special annotations.
Color gave speed to professional reading. The underwriter did not need a prose paragraph for every building if the sheet could show material and use quickly. The symbol system converted the city into a visual rate file. A fire wall, a cornice, a sprinkler, a hydrant, an opening, a roof note, a street width, or a factory label could alter the meaning of a block. Color was not decoration. It was compressed argument.
The key also reminds the modern reader that Sanborn maps were not transparent windows. A code has authors. It has purposes. It carries assumptions about which facts matter. The Library’s collection guide notes that the insurance industry dictated the original selection of information and the way that information was portrayed. That sentence should sit beside every beautiful image of a Sanborn sheet. The colors show a city under a business gaze. The gaze is precise. It is also partial.
Partial sources can be valuable when their edges are visible. The Sanborn sheet gives walls, roofs, use labels, hazard notes, water systems, street widths, and property outlines. It gives little about rent, wages, illness, family structure, racial violence, political bargaining, or daily movement unless those facts left a trace in use, ownership, address, or building form. The 1904 directory adds names, trades, offices, churches, banks, fire stations, and addresses, but it also has a business-directory bias. Together they improve the reading. Neither record can explain justice, grief, displacement, or power by itself.
A Sanborn map works best as evidence inside its chosen field. A building footprint can support a claim about structure. A use label can support a claim about likely activity. A change across editions can support a claim about urban transformation. A claim about lived experience needs other records beside it.
What The Map Leaves Outside The Frame
The temptation with Sanborn maps is to let detail become proof of completeness. The maps feel exhaustive because they are busy in the right places. They name things that many public narratives ignore. They rescue old laundries, stables, sheds, and small shops from the silence of grand history. They make a vanished block touchable. They let a resident ask what stood where a parking lot now sits. That recovery has real democratic value, so long as the reader remembers the map’s assignment: fire insurance decisions, built exposure, and material risk.
The issue is sharpest where the map crosses social history. Race may appear indirectly through neighborhood patterns, public buildings, business locations, or later comparison with census, city directory, deed, school, church, court, and newspaper records. It rarely appears as the lived structure of power. Labor appears through factories, warehouses, rail connections, and commercial uses. It rarely appears as wages, injuries, hiring, skill, discipline, or collective action. Gender appears through household and workplace geographies only when other records help draw it out. Ordinary life sits behind the walls.
That does not make the Sanborn map cold evidence in a bad sense. It makes it disciplined evidence. The sheet guards against certain myths because it forces the reader to confront material arrangement. A city cannot say all its risk came as a surprise if the built environment had long been drawn as exposure. A landlord cannot pretend a use never existed if a reliable historical sheet shows it. A preservation fight cannot depend only on sentiment if the map can document a building’s age, use, and relation to a district. A cleanup file cannot rely only on living memory if old industrial use appears in the historic record.
The map also guards against nostalgia. A beautifully drawn industrial block may have been dangerous, dirty, badly paid, or racially exclusionary. A vanished amusement district may have carried joy and fire risk in the same timber frame. A downtown rebuilt after disaster may show pride and exclusion on the same sheet. The Sanborn map gives those tensions coordinates, then asks companion records to carry the human argument.
For an Outside In Print essay, that is the productive discomfort. The object is concrete: a bound fire insurance map. The system is larger: private insurance, urban growth, public archives, environmental liability, historical memory, and the civic habit of turning material traces into claims about responsibility. The map opens the system because it refuses to flatter the city. It offers no banner, no speech, no recovery slogan. It offers structure.
Coney Island, Drawn Three Times
Jacksonville supplies the fire and the reconstruction. Coney Island supplies a second test of the time-series method. The Library of Congress Sanborn time-series essay walks readers through Coney Island maps for 1895, 1906, and 1930. The 1895 view shows a resort district with bathing, dining, dancing, amusements, and mostly wood construction. The 1906 map shows a more elaborate amusement district, including Dreamland, with rides, attractions, water features, and firefighting details. A major fire destroyed Dreamland in 1911. By 1930, the Library notes, part of the site had become the public park known as Seaside Park, while other parts were rebuilt as smaller arcades and amusements.
That sequence has none of Jacksonville’s Southern civic mythology. It gives a different American setting: leisure, spectacle, shorefront capital, seasonal crowds, wood structures, and the conversion of pleasure into mapped exposure. The Sanborn sheet handles the amusement district with the same system it brings to warehouses and factories. A ride is also structure. A pavilion is also fuel. A famous place is also a set of walls, openings, roofs, paths, and suppression problems.
The Coney Island sequence shows why Sanborn maps became useful far beyond insurance. They let readers see change without relying on the self-advertising language of a place. An amusement district will always sell itself through novelty. A rebuilt downtown will always claim progress. A resort will always choose its best angle. The fire insurance map has a narrower motive. That motive can make it a more disciplined witness.
In 1895, the Coney Island map captures a resort in a certain material phase. In 1906, the map captures larger and more elaborate amusements. After the 1911 Dreamland fire, the 1930 sheet captures a reorganized place. The lesson is not that Coney Island declined, improved, or fulfilled a simple cycle. The lesson is that a place dedicated to pleasure also lived inside the hard facts of construction, crowding, access, water, and fire. A Sanborn map can make that double life visible.
That double life returns to Jacksonville. Cities prefer to narrate disaster through heroism and recovery. Amusement districts prefer to narrate themselves through wonder. Industrial districts prefer to narrate themselves through production. The map answers all three with a common grammar. Where are the walls? What are they made of? What use sits inside? How close is the next exposure? Where is the water? What changed in the next edition?
This is why the second case earns its place. Without Coney Island, the Jacksonville map could seem like a special artifact tied mainly to the Great Fire of 1901. With Coney Island beside it, the Sanborn system appears as a national way of seeing. It could draw the trauma of a burned Southern downtown and the glitter of a New York amusement district because both were, in the insurance view, arrangements of combustible value.
The Old Sheet In The New File
The strongest evidence of the Sanborn map’s afterlife may sit in a modern environmental file, far away from sepia romance. The Environmental Protection Agency’s All Appropriate Inquiries page explains that AAI is the process for evaluating a property’s environmental conditions and potential contamination liability. EPA says Phase I Environmental Site Assessments funded with Brownfields Assessment Grants must comply with the AAI Final Rule at 40 CFR Part 312. EPA’s template language for historical research specifically includes fire insurance maps among historical use sources that may be reviewed.
That is a remarkable second life for a nineteenth-century insurance tool. A map made to price fire risk can help a modern environmental professional ask what used to happen on a parcel. A dry cleaner, auto repair shop, filling station, foundry, machine shop, laundry, print shop, warehouse, or industrial yard may leave a trace in the old sheet. The original underwriter cared about fire exposure. The modern reviewer may care about solvents, tanks, metals, petroleum, fill, waste handling, or recognized environmental conditions.
The legal frame is contemporary, but the evidence can be old. Under 40 CFR Part 312, all appropriate inquiries include historical sources where they are useful, available, and reasonably ascertainable under the rule’s structure. EPA’s Brownfields materials place fire insurance maps in the practical kit of records that can help reconstruct prior uses. The Sanborn sheet therefore moves into a new civic role. It can affect lending, redevelopment, cleanup planning, liability protection, and public confidence in reuse.
A public example makes the point without vendor marketing. In a U.S. Army Corps of Engineers Phase I Environmental Site Assessment report for the Upper St. Anthony Falls Disposition in Minneapolis, the Corps states that it gathered and reviewed historic data, including fire insurance maps, survey plat maps, aerial photography, topographic maps, construction documents, and interviews. The report’s Sanborn section identifies available historic maps for 1885, 1890, 1904, 1912, 1949, 1950, 1952, 1966, and 1969. It also says no unusual entries were identified in the Sanborn maps.
That last fact is as important as a smoking-gun discovery. A record can help by confirming risk; it can also help by failing to show a concerning use in a place where one might be suspected. The Sanborn map does not become an oracle. It becomes one checked source in a disciplined inquiry. Its value lies in what it can document and in the accountable way it can be set beside other records.
This modern use should change how we look back at the old Jacksonville sheet. The map is an antique survivor and part of a longer chain of risk reading. Fire insurance, preservation, genealogy, planning, brownfields assessment, and neighborhood memory all ask versions of the same question: what did this place used to be, and what does that past require of us now?
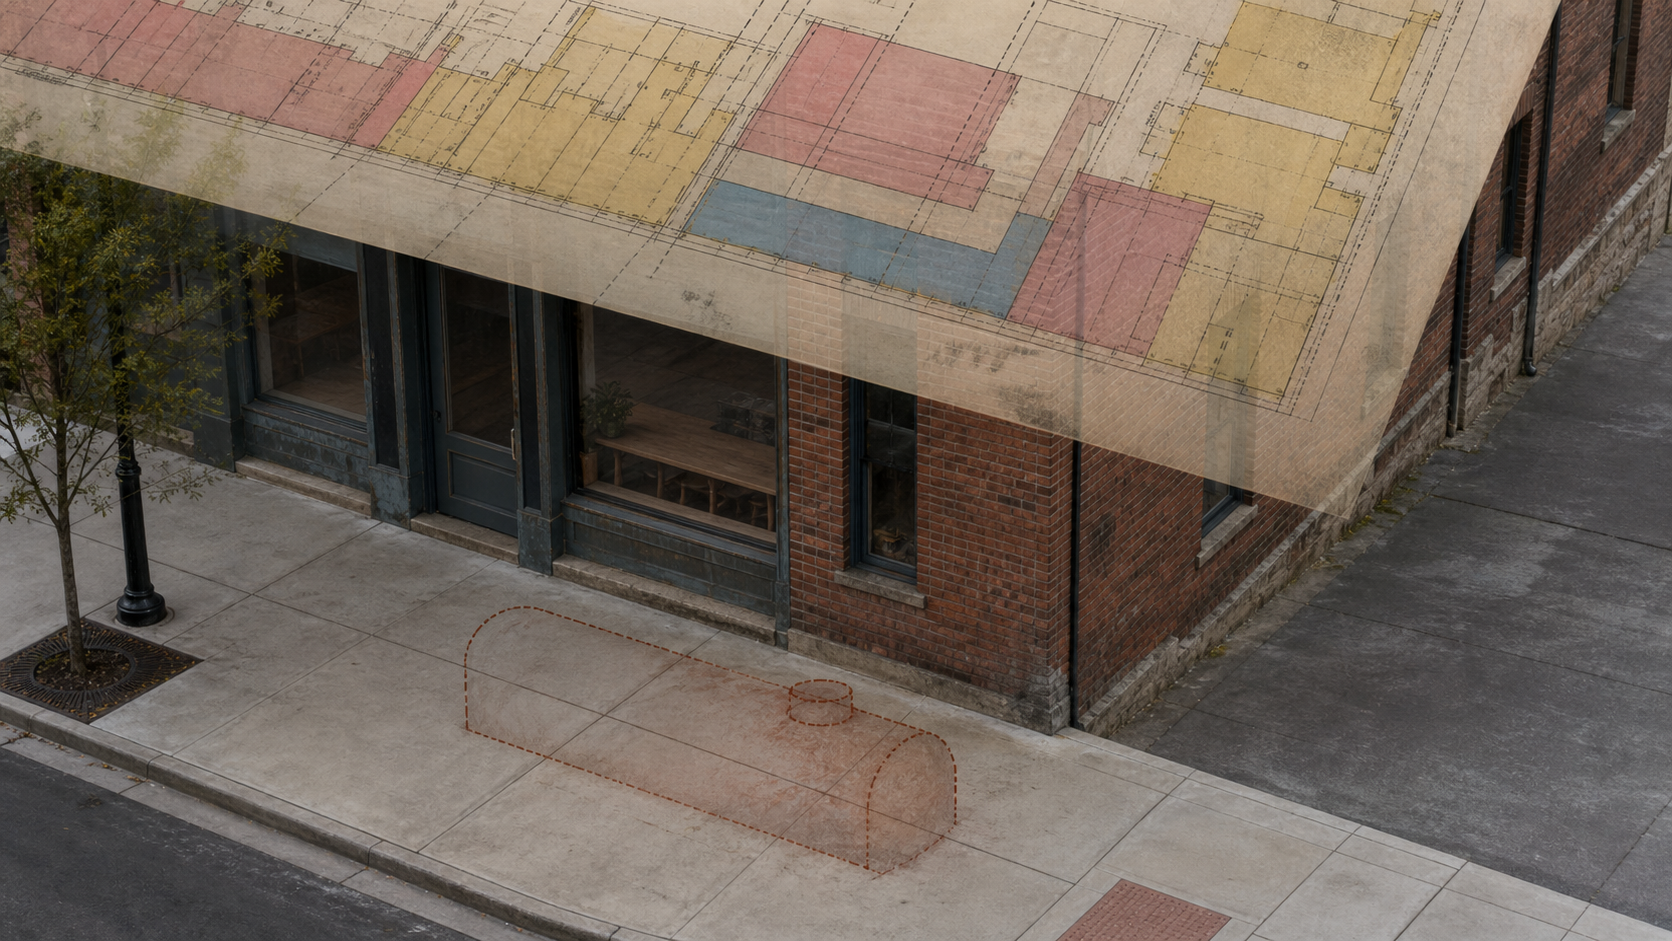
Image 2: old insurance evidence inside a modern due-diligence file.
A Public Record With Private Parentage
The Library of Congress online Sanborn collection makes public access feel inevitable. That feeling deceives. The maps were specialized commercial records. Their public life depends on acquisition, cataloging, preservation, scanning, metadata, rights review, institutional patience, and the old accident by which useful records outlive the business need that created them. The Library’s online checklist is based on its 1981 publication, Fire Insurance Maps in the Library of Congress, prepared by the Geography and Map Division with an introduction by Walter W. Ristow. That checklist frame changes the public story because the collection did not appear through sentiment alone. It came through bibliographic labor.
Once public, the maps change the citizen’s relation to place. A resident can look up an old address and find the building that used to stand there. A preservationist can compare editions before making a claim about age or continuity. A local historian can rebuild the geography of a business district. A family researcher can understand the block around an ancestor’s address. A neighborhood organizer can see old industrial adjacency that never made it into public memory. A student can learn that a city is an artifact made out of choices, materials, and risks.
Public access also changes scale. A resident no longer has to accept the current parcel as the natural unit of memory. The old sheet may reveal that a present lot once belonged to a larger works, that a quiet side street once carried commercial load, that a vacant strip once touched a rail spur, or that a familiar corner has held several identities under the same address habit. The archive lets ordinary readers test the present street against older forms of use. That testing is modest, but it can be politically serious. It turns curiosity into a record-based question.
The public record also changes the burden of argument. Without the map, memory can harden around convenient stories. With the map, claims can be checked. A vanished building becomes less vague. A disputed use becomes less foggy. A remembered fire district can be put against a sheet. A redevelopment promise can be read beside a former use. The sheet does not end argument. It improves the argument by making some of its objects visible.
Private parentage should remain in view. The insurance industry mapped what its work required. That origin helps keep modern readers honest. A source created by power can expose truths useful to people outside power, while carrying the shape of its creation. Tax lists, court records, police files, property maps, school reports, military files, corporate ledgers, and city directories often survive because an authority or business needed them. Later readers use them to recover lives and systems that the original record only partly respected.
Sanborn maps belong to that archive family. They are disciplined records. Their ethics emerge in use. A careful reader can use them to challenge amnesia, document change, and ask better questions. A careless reader can turn them into pretty wallpaper or false completeness. The difference is method.
Jacksonville’s 1903 atlas shows method in a city carrying fresh damage. It asks the reader to put romance aside long enough to inspect the rebuilt block. It asks the reader to see that rebuilding is material before it is symbolic. It asks the reader to notice how a private market’s need for dependable information produced a public memory tool.
The Discipline Under The Beauty
The Sanborn map is beautiful because it is disciplined, and it is dangerous because beauty can hide discipline. A person who first meets the map as an image may see color, old typography, street grids, and handmade charm. A person who stays with it sees an apparatus. The apparatus selected, measured, classified, coded, updated, and circulated urban risk. It made the city legible to insurance capital. Later, it made the city legible to archives, preservation offices, environmental files, and residents trying to recover what the present surface has buried.
That later usefulness creates an ethical demand. Cite the sheet. Check the key. Date the edition. Compare maps when possible. Treat paste-on corrections, volume divisions, and later updates with care. Separate what the map shows from what the historian infers. Pair it with newspapers, directories, deeds, census records, oral histories, photographs, fire reports, government files, and archaeological or environmental evidence when the claim requires them. Give the map its due without asking it to carry what it cannot know.
Return, then, to the table. Put the 1903 Sanborn atlas beside the 1904 Polk directory. One page draws the rebuilt city as exposure: walls, roofs, hydrants, street widths, and uses. The other page counts the city as address: names, trades, banks, churches, fire stations, architects, and offices. The old moss at Davis and Beaver burned because material facts met weather, labor, storage, construction, and chance. The rebuilt records turned the aftermath into paper that could be priced, found, lent against, regulated, remembered, and questioned.
The fire map priced combustible value. The directory counted the addresses that came next. Read together, they give the public a harder kind of memory: a city seen through the records that once made it chargeable, reachable, and rebuildable.
Working Sources
Primary and official sources consulted for this flagship expansion include the Library of Congress Sanborn collection introduction, collection guide, time-series essay, Jacksonville 1897/1903/1913 item records, the Jacksonville Public Library 1904 Polk city directory, Florida Memory’s Great Jacksonville Fire exhibit, EPA’s All Appropriate Inquiries guidance, 40 CFR Part 312, and the U.S. Army Corps of Engineers Upper St. Anthony Falls Phase I Environmental Site Assessment. A full source-hardening checklist is included in source-checklist.md.