The Water’s Rising: What the Data Really Says About Extreme Weather
“The weather’s never been like this!”
It feels like you hear this after every flood, fire, or storm lately.
From Houston to Vermont, from wildfires in Canada to flash floods in Texas, something about the weather seems off.
Louder.
Meaner.
Less predictable.
So what’s really going on?
Is the weather actually worse? Or are we just paying more attention?
Turns out, the data backs it up.
Heavy precipitation events are becoming more frequent and more intense, and exposure turns them into disasters.
Source Note
This is the second piece in a series on the Camp Mystic flood and the rising threat of extreme weather in the United States.
I work as a life safety consequences specialist with the U.S. Army Corps of Engineers, where I analyze the human impacts of flood, storm, and infrastructure failure scenarios.
My job is to understand how and where people die in disasters, and what we can do to prevent it.
Disclaimer: The views expressed in this article are my own and do not represent the official position of the U.S. Army Corps of Engineers or the federal government.
If you missed the first piece, read What Happened at Camp Mystic? A Primer on the July 4 Texas Flood .
So, is the weather actually getting worse over time? Well…
It Depends on the Timeframe
Whether it’s “getting worse” or not depends…
on how far back you look.
Weather is chaotic by nature.
Some years bring dozens of disasters. And some years… nothing.
That randomness is why short time windows can be misleading, like trying to understand the stock market by watching a single trading day.
But zoom out, and a different picture emerges.
Climate scientists say the “signal” of human-caused warming has now emerged from the “noise” of natural variation. Over the last 30 to 40 years, we’ve entered a new statistical climate, one where the odds have changed.
Think of it like this.
We may not be getting more storms in every category.
Just more storms that we consider disasters.
Or if you’re a stats guy.
The curve hasn’t shifted much.
But the tail got fatter,
and that’s where the damage lives.
What the Data Can *and Can’t* Tell Us
Most national climate trend data starts around 1980.
That’s not arbitrary. It is when we began getting consistent satellite coverage, Doppler radar, and standardized instrumentation across the country. But it does mean we’re working with a limited window.
Older floods, fires, and heatwaves may be missing from the record or measured inconsistently… and
That makes long-term comparisons tricky.
There’s also that other question people like to ask:
What’s driving the change?
Is it human activity? Is it natural variation? Is it a hoax or a conspiracy theory?
Those debates belong in science, policy, and politics.
On the ground, for engineers, planners, and emergency responders, the planning problem is immediate.
The trend is real. The consequences are mounting.
And the past is no longer a safe guide to the future.
The Extremes Are Escalating
The U.S. data shows the pattern.
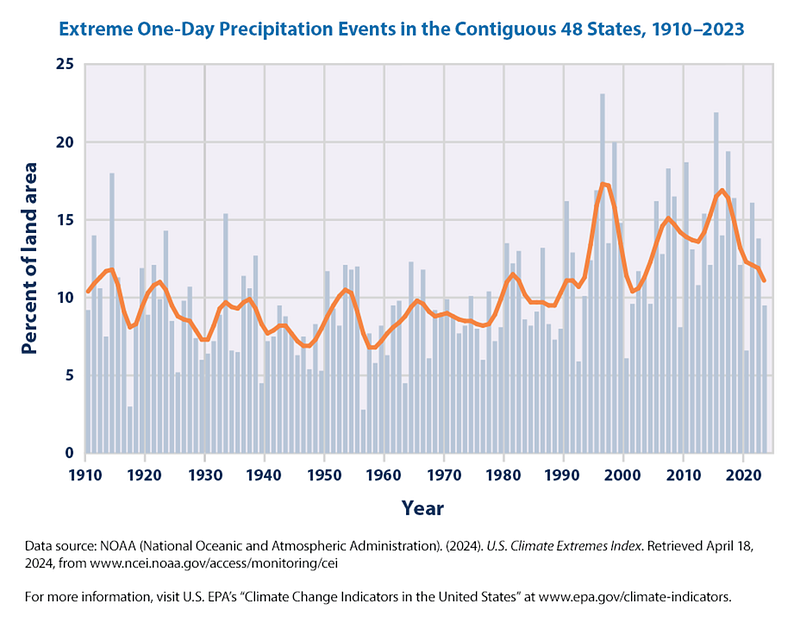
Nine of the ten wettest years on record have happened since 1995. The share of the country hit by very heavy daily rainfall has grown about 0.5% per decade since 1910. That is a slow rise, but a relentless one, and most of the increase has come since 1980.
More rain now falls in short bursts , not daylong showers. That means more flash floods and runoff. Heatwaves are longer, hotter, and cover more ground. Cold extremes are becoming less common, while record highs are becoming the norm. There may not be more storms overall, but the strongest storms, Category 3 and above, are increasing , along with rainfall and wind speeds.
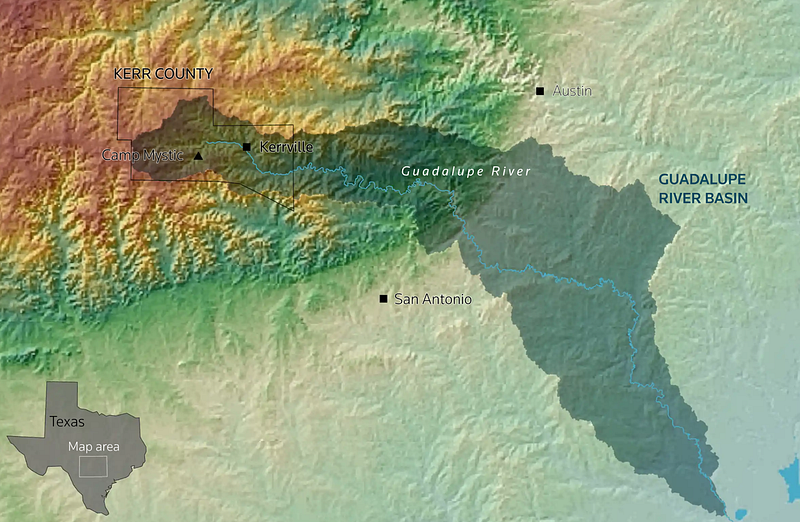
Texas Is Flash Flood Ground Zero
Texas has always been wild: floods in spring, droughts in summer, and sideways hail whenever it feels like it.
But the past few decades have reshaped the state’s rainfall profile in dramatic ways.
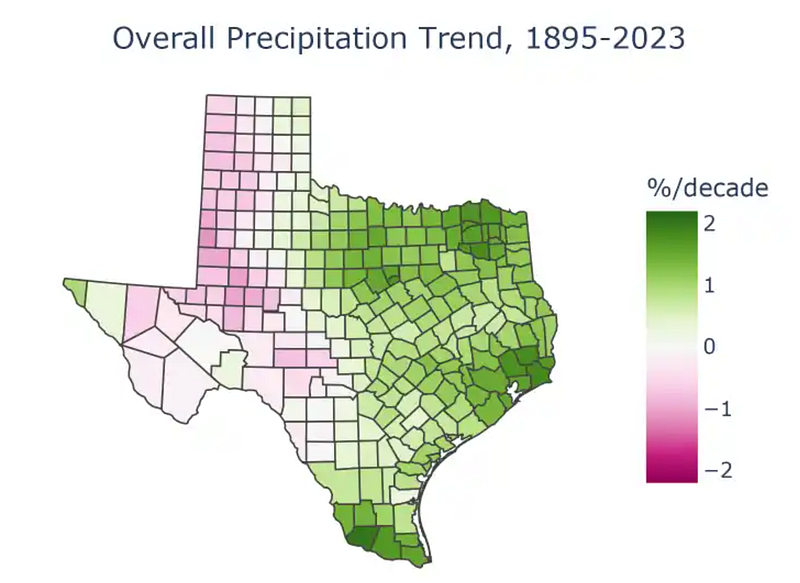
Central and Eastern Texas now average about 10% more annual rainfall than a century ago. Several of the wettest months in state history occurred just in the last 20 years. More rain falls in intense downpours, separated by longer dry spells.
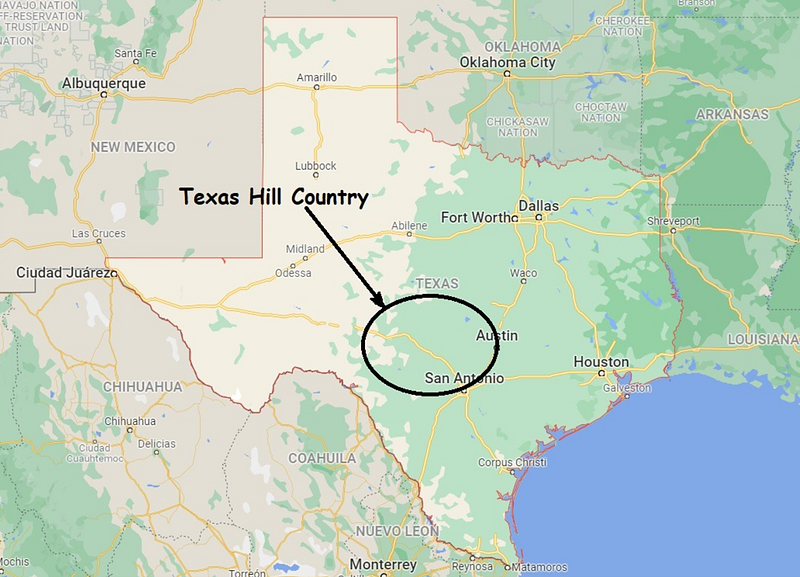
This pattern is especially dangerous in regions like the Hill Country, where steep slopes, rocky soil, and fast-moving tributaries funnel rainwater straight into rivers.
The 2025 Guadalupe River flood wasn’t just intense.
It was one of the most violent floods in over a century of records.
What’s Getting Worse, and What’s Just Noise?
Not every type of extreme event is on the rise.
Some patterns are complex and others are poorly measured.
Some types of extreme weather events are surging.
Others are harder to pin down.
Here’s a rough breakdown:
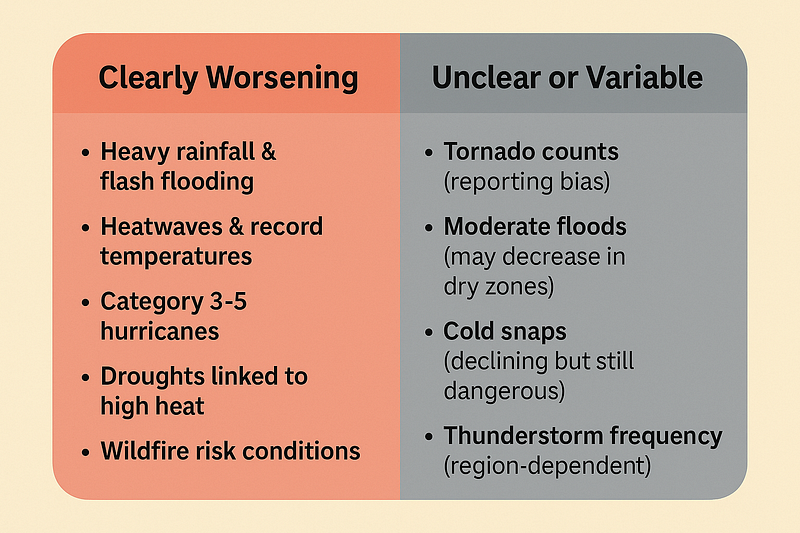
While uncertainty surrounds all types of extreme weather events,
Several of the hazards doing the most damage, floods, fires, and heat, are moving in the same direction.
The big takeaway:
We’re not just more exposed…
For floods, fires, and heat, the damaging tail is moving in the wrong direction.
Was the Camp Mystic flood a fluke?
The Guadalupe River rose more than 25 feet in under 90 minutes.
“That’s not normal.”
Right?
The flood wiped out power, snapped gauges, and obliterated cabins.
Texas State Climatologist John Nielsen-Gammon projects that by 2036, Texas could see 6 to 10% higher rainfall intensity and 30 to 50% more frequent extreme rain events.
A New Baseline for Risk
What does all this mean for planning, insurance, infrastructure, and safety?
It means the old numbers won’t hold up.
Flood maps based on historical records may now understate true risk. Stormwater systems built for 20th-century weather may be overwhelmed by 21st-century rain . People living in floodways or fire zones may be rolling higher-stakes dice than they realize.
Some Camp Mystic cabins sat inside a mapped regulatory floodway, and the paperwork did not remove the physical risk.
Permits were granted.
Some buildings were allowed to remain or were removed from mapped high-risk categories through formal flood-map processes.
Generations of campers slept there.
But this isn’t just about one camp.
It’s about the quiet assumptions, baked into zoning laws and insurance tables, the belief that the future will behave like the past.
Unfortunately, it won’t.
The baseline has shifted. The playbook needs to change.
What’s Next
In the next piece, I’ll break down why the warnings failed, how buildings ended up in a known danger zone, and what a risk-informed approach would’ve done differently.
Because what happened at Camp Mystic could happen again,
And next time we need to be ready.